Observation of Bose-Einstein Condensation in Lithium

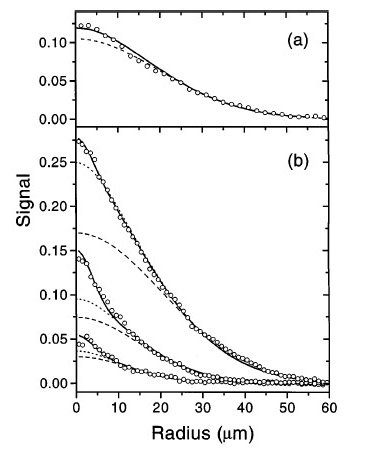
Figure 1
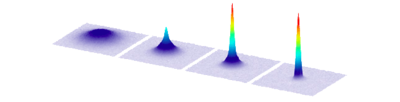
"Spatial profiles of trapped ultracold 7Li gas. The vertical axis gives the magnitude of the phase-contrast signal intensity relative to the probe intensity. The data points are taken from observed images. The solid curves are calculated by fitting Bose-Einstein distributions to the data, the short-dashed curves are the same distributions with the condensate atoms removed, and the long-dashed curves classical (Gaussian) distributions fit to the tails of the data. The calculated signals are convolved with a Gaussian function to account for a limited resolution of the imaging system, assuming an effective resolution of 4µm. For the data in (a), the probe detuning was +191 MHz, and the fitted distribution has 9.0 x 10⁴ atoms at a temperature of 309 nK. The number of condensate atoms is ~1, indicating that the gas is just approaching degeneracy. In (b) a sequence of profiles that exhibits condensate peaks is shown. From the strongest to weakest signals, the total number of atoms and fitted temperatures are 1.01 x 10⁵ atoms at 304 nK; 2.6 x 10⁴ atoms at 193 nK; and 6.6 x 10³ atoms at 122 nK. The corresponding numbers of condensate atoms are 500, 810, and 270, respectively. The probe detuning for these data was -130 MHz."
The figure is from:
"Bose-Einstein Condensation of Lithium: Observation of Limited Condensate Number",
C. C. Bradley, C. A. Sackett, and R. G. Hulet,
Phys. Rev. Lett. 78, 985 (1997).