Observation of BEC in a dilute gas

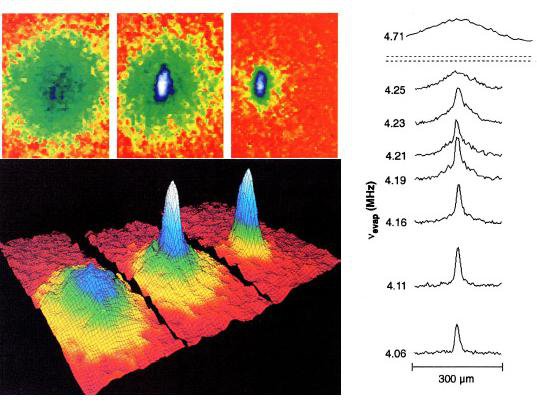
Figure 1
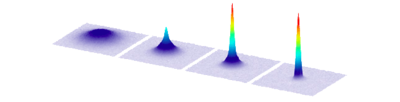
"Observation of BEC in rubidium by the JILA group. The upper left sequence of pictures shows the shadow created by absorption in the expanding atomic cloud released from the trap. Below, the same data are shown in another representation, where the distiribution of the atoms in the cloud is depicted. In the first frame to the left, we see the situation just before the condensation sets in, in the middle a condensate peak with a thermal background is observed, whereas the third figure shows the situation where almost all atoms participate in the condensate. The thermal cloud is seen as a spharically symmetric broad background, whereas the sharp peak describing the condensate displays the sqeezed shape expected in an asymmetric trap. The diagram to the right cuts through the atomic cloud when it is cooled by more and more atoms are being evaporated."
The figure is from:
M.H.Anderson, J.R. Ensher, M.R. Metthews, C.E Wieman and E.A. Cornell, Science 269, 198 (1995).
See also:
E. A. Cornell and C. E. Wieman, Rev. Mod. Phys. 74, 875–893 (2002).