Bose-Einstein Condensation in Sodium

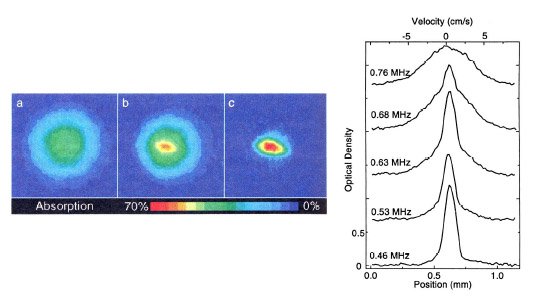
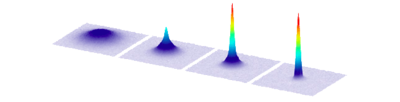
Figure 1
"Observations of BEC in sodium atoms achieved in the MIT group. The left-hand side shows shadow images, where the density of the condensate is seen to grow with decreasing temperature from left to right. The right-hand diagram show cuts through the density as the condensate develops." The figure is from [1].
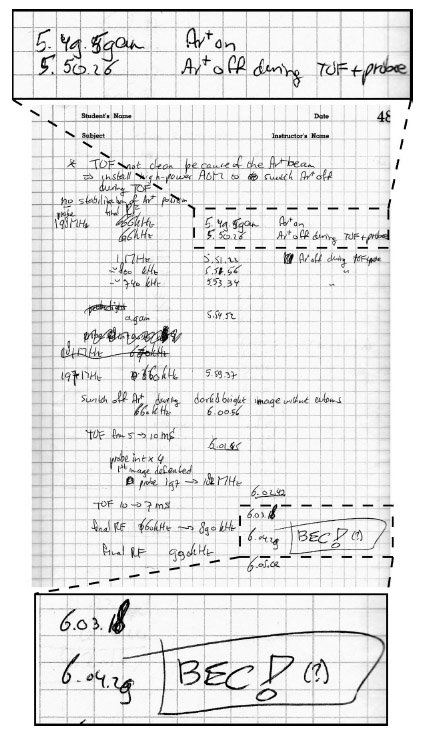
Figure 2
"One page of the lab book during the night of September 29, 1995, when BEC was first observed at MIT. The hand writing is by Klaasjan van Druten. At 5:50 a.m., we had installed a new acousto-optical modulator to switch off the optical plug (Ar ion laser beam). Fifteen minutes later, we had the first definitive evidence for BEC in sodium." The figure is from [2].
[1] K.B. Davis, M.-O. Mewes, M.R. Andrews, N.J. van Druten, D.S. Durfee, D.M. Kurn and W. Ketterle,
Phys. Rev. Lett. 75, 3969 (1995),
[2] W. Ketterle, Rev. Mod. Phys. 74, 1131–1151 (2002).